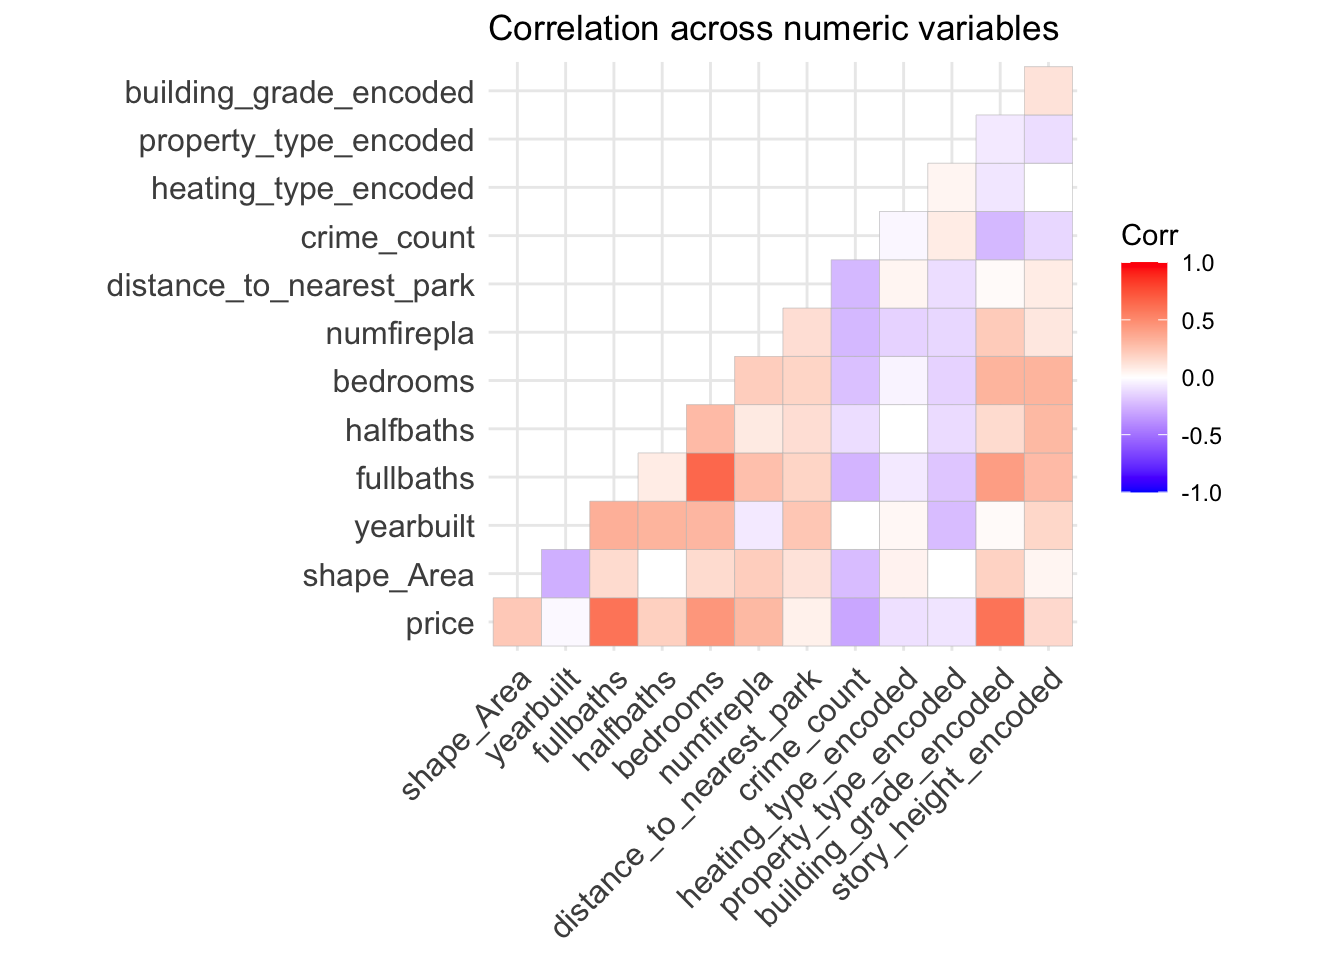
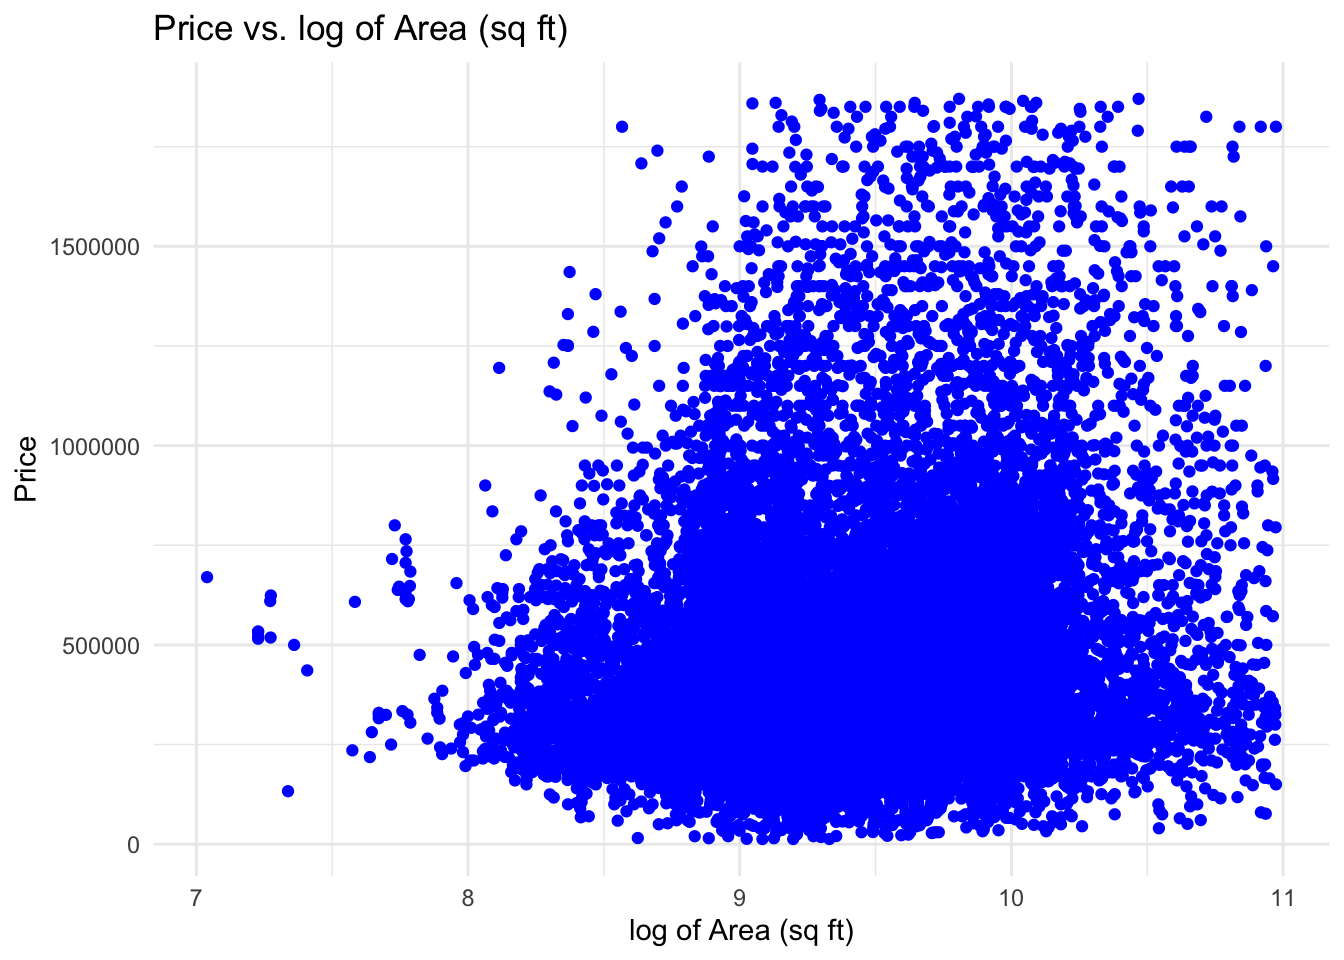
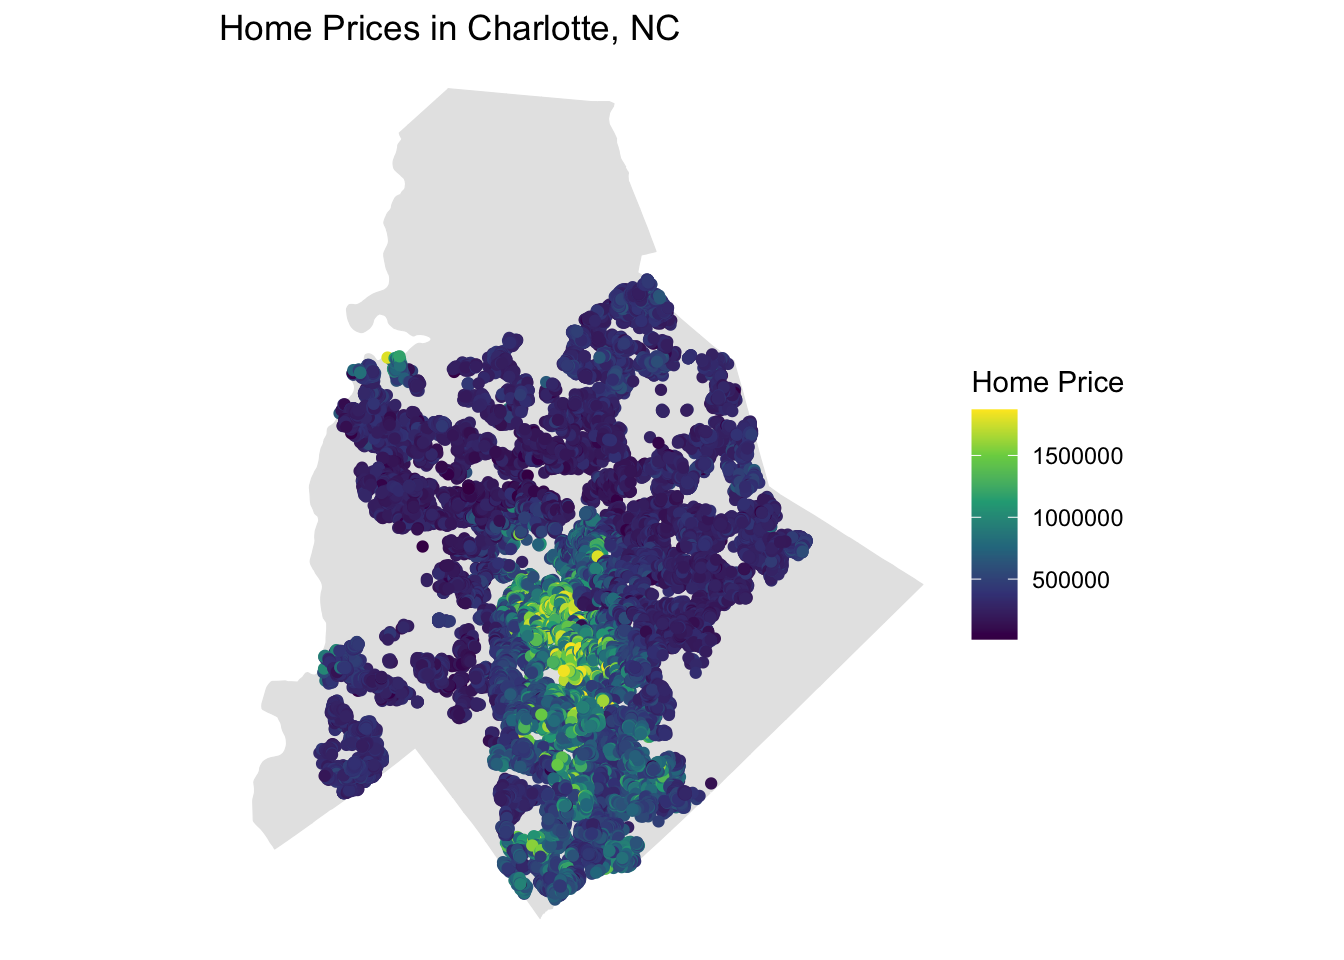
| Physical Attributes | Total home size combined with professional building grade classification emerged as the primary drivers of market valuation. | p < 0.001 |
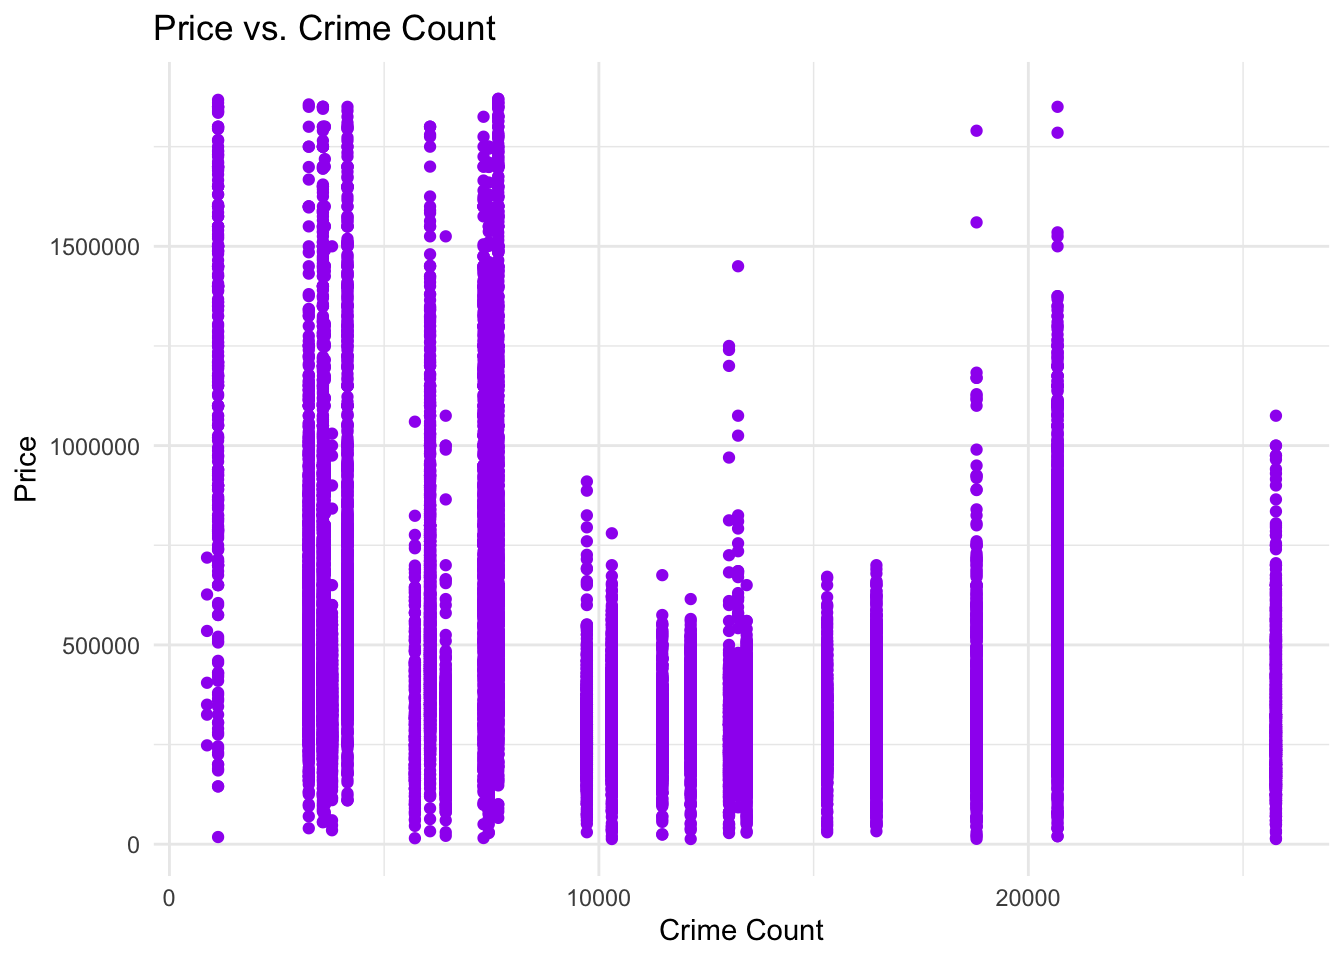
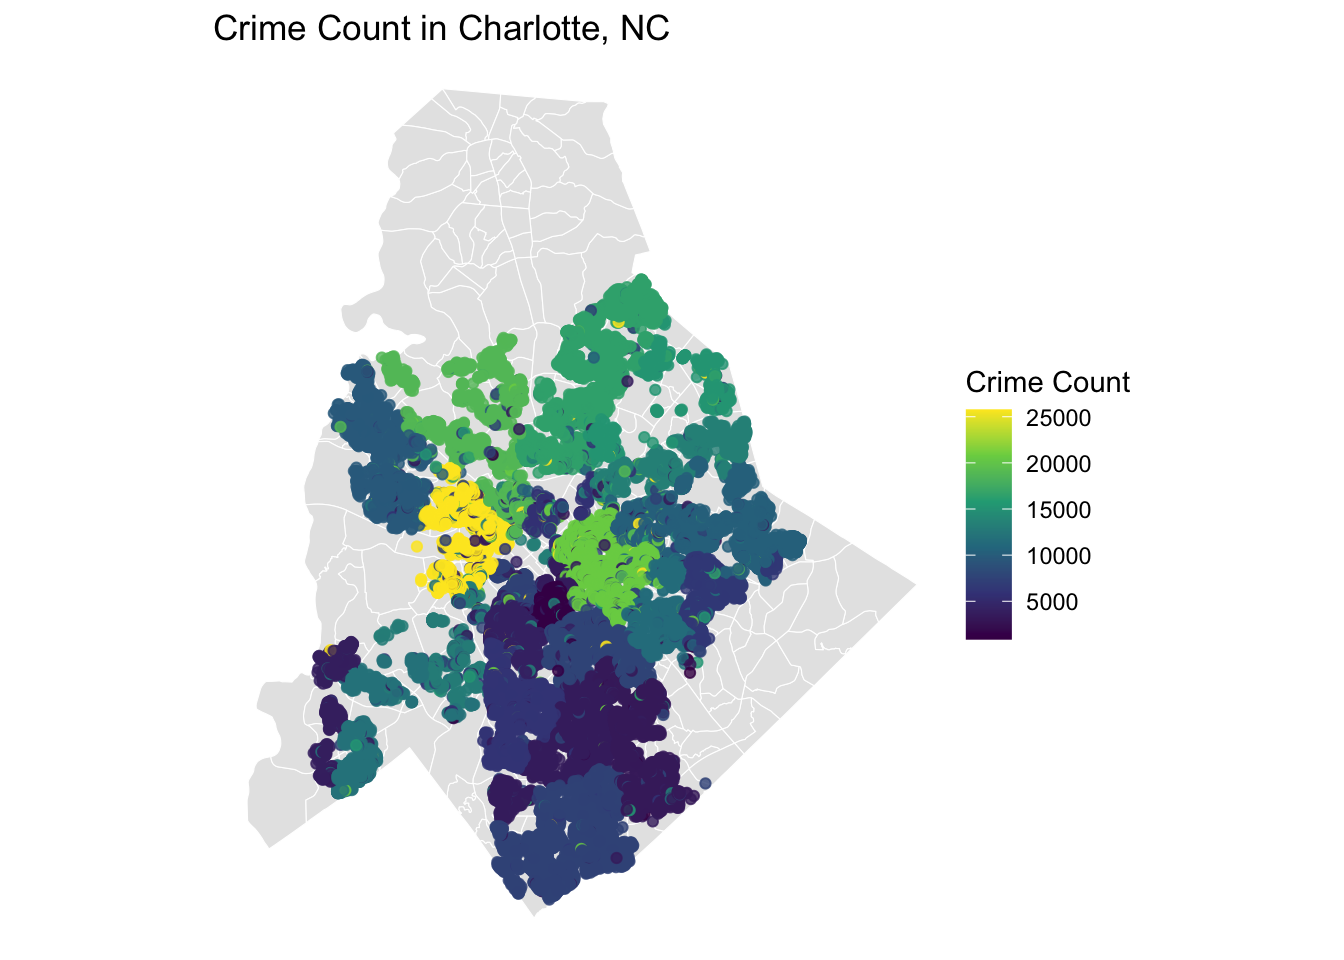
| Socio-Economic | Elevated regional crime rates systematically depressed predicted property values across the metro area. | Strongly Negative |
| Environmental Proxies | Park proximity demonstrated a comparatively weak effect on valuation, challenging the assumption of a uniform green-space premium. | Weak Correlation |
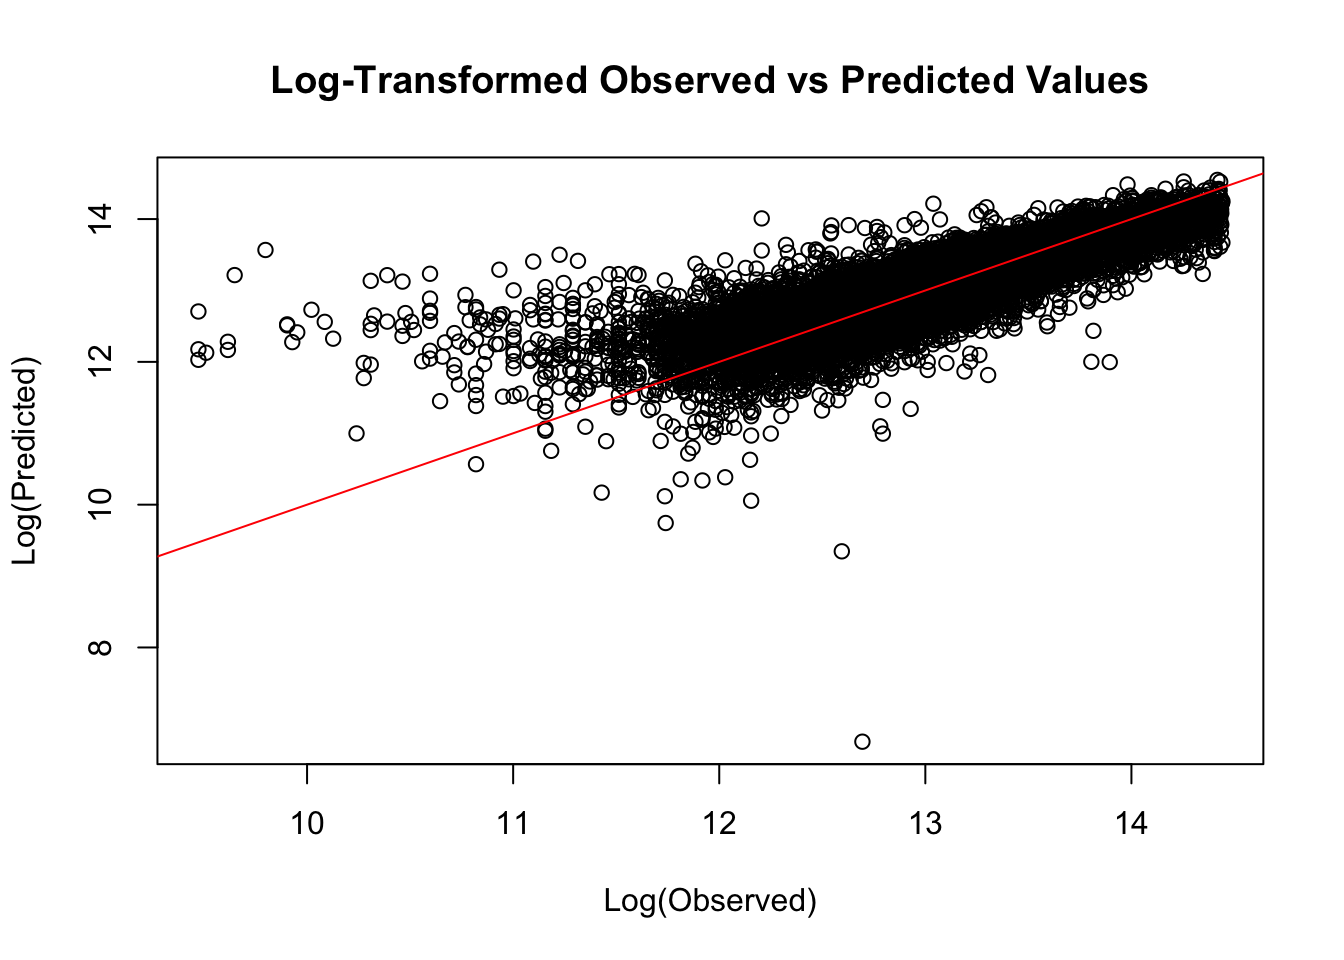
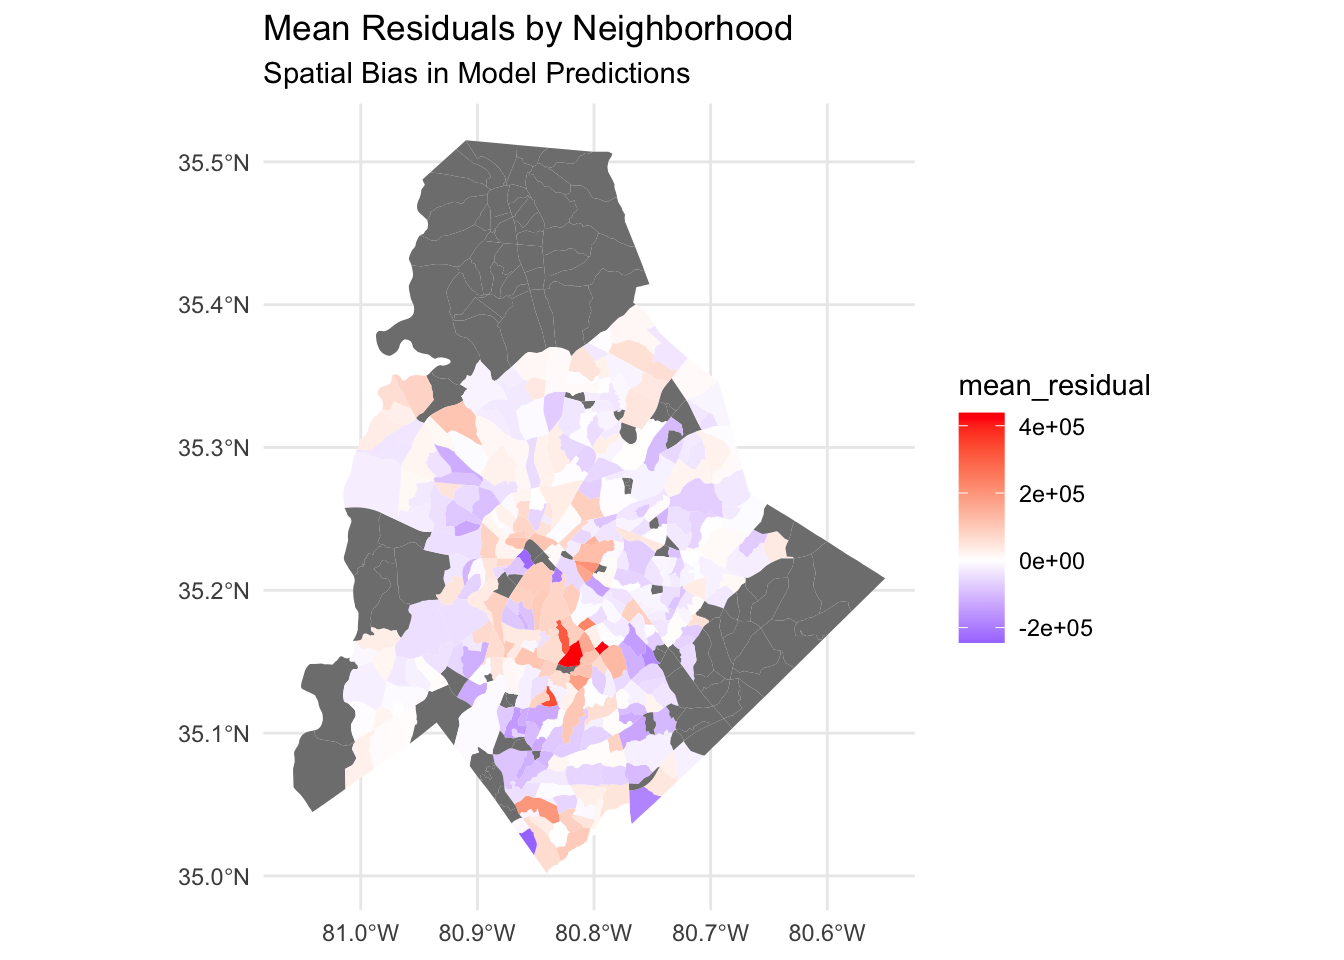
| Systematic Bias | Critical discovery: the model consistently underpredicts central urban neighborhood values while overpredicting peripheral suburban properties. | High Magnitude |