Analyzing Spatial Patterns in Housing Values
Philadelphia, Pennsylvania | Neighborhood Characteristics Analysis

Overview
This project explored the relationship between median housing values and neighborhood characteristics at the Census block group level in Philadelphia. Using spatial analysis techniques and Ordinary Least Squares (OLS) regression, the project aimed to identify socioeconomic and physical traits that influence housing values and uncover spatial patterns that inform urban development strategies.
Objective
Quantify the impact of neighborhood characteristics on housing values using an OLS regression model and identify spatial patterns that could guide policy interventions for neighborhood improvement.
Methodology
Data Cleaning
- Started with 1,816 block groups from the Philadelphia Census dataset.
- Removed block groups with population < 40 or no housing units.
- Removed block groups with median house values < $10,000 or > $800,000 with low household income.
- Final dataset included 1,720 block groups.
Exploratory Data Analysis
Examined summary statistics and plotted histograms for the dependent variable (median house value) and predictors:
- PCTVACANT – Proportion of vacant housing units
- PCTSINGLES – Proportion of single-family units
- PCTBACHMOR – Proportion of residents with a bachelor's degree
- LNNBELPOV100 – Number of households living in poverty
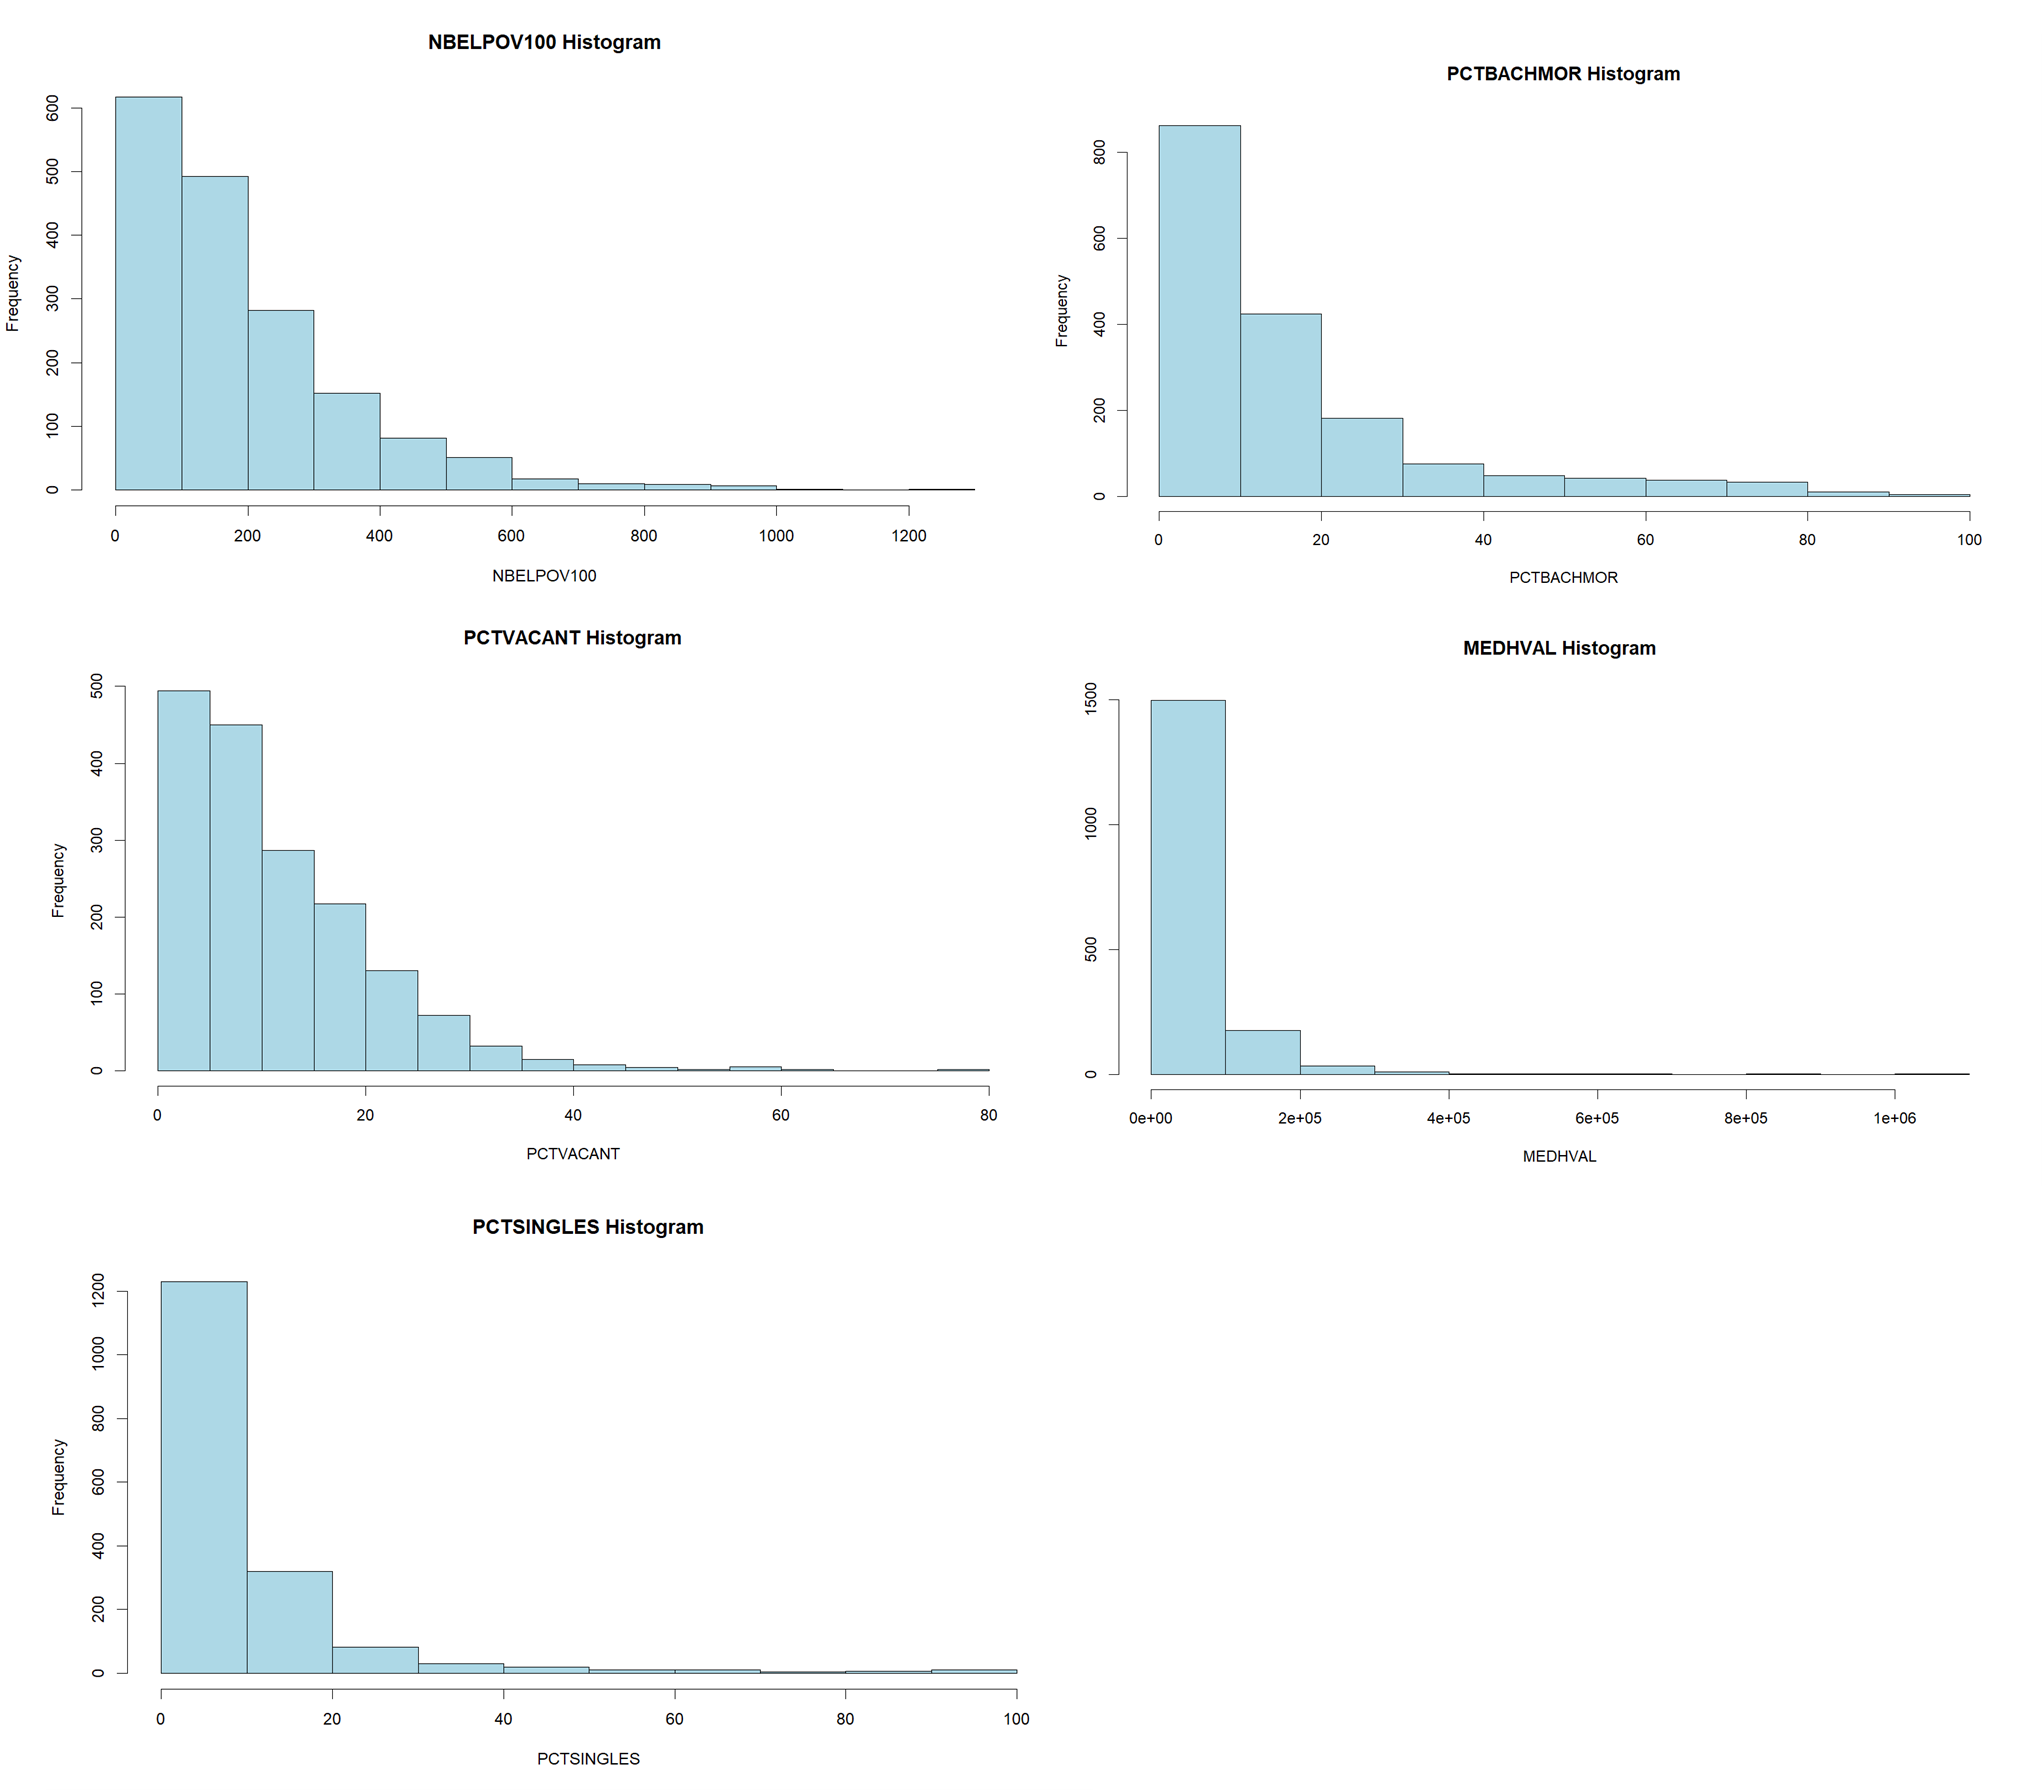
Histograms of original variables showing right-skewed distributions
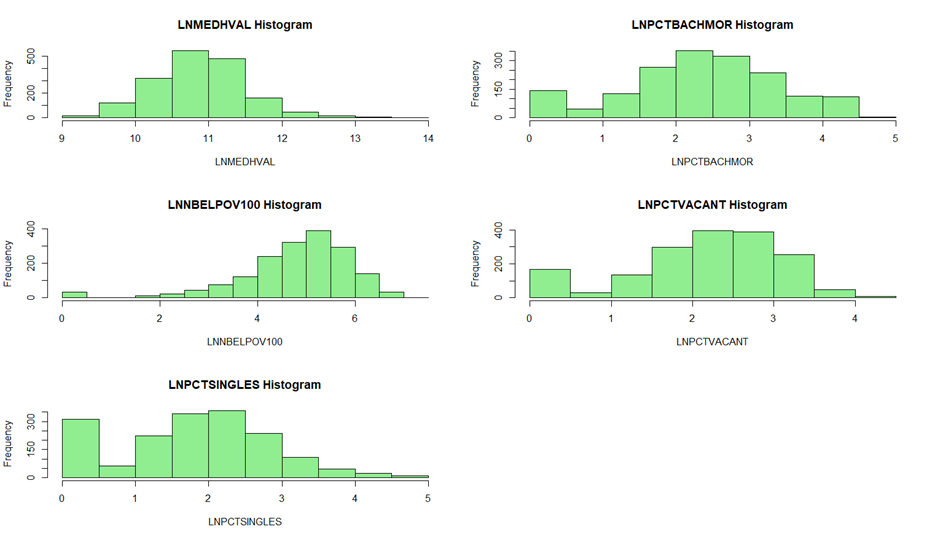
Histograms of log-transformed variables showing improved normality
Produced choropleth maps in R to visualize spatial patterns of housing values and neighborhood characteristics across Philadelphia:

Choropleth map showing spatial distribution of median housing values across Philadelphia
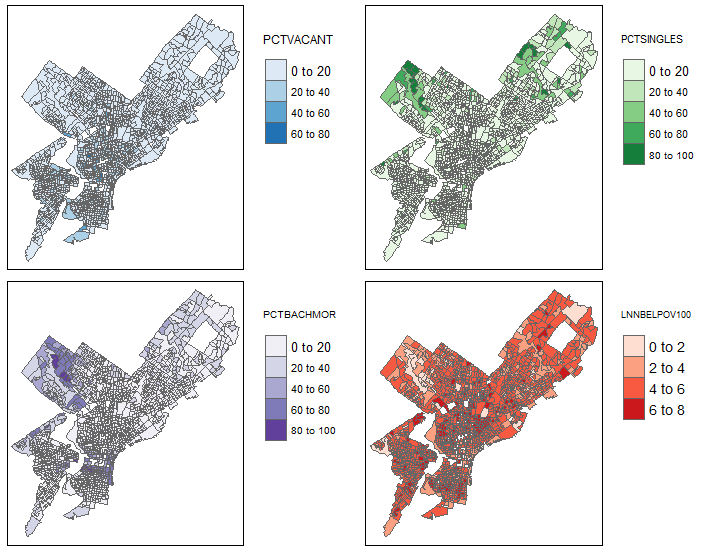
Choropleth maps showing spatial patterns of vacancy rates, single-family homes, education levels, and poverty
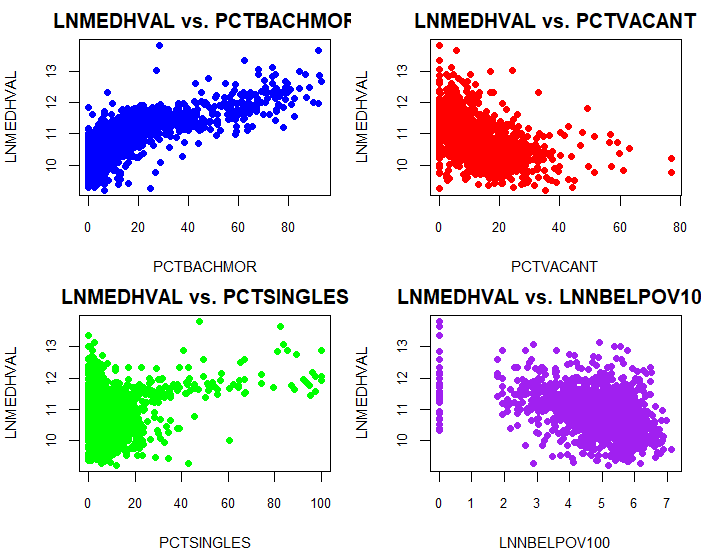
Scatter plots showing relationships between housing values and each predictor variable
Regression Analysis
Performed multiple linear regression using the following predictors:
- PCTVACANT (Negative correlation with housing values)
- PCTSINGLES (Positive but minor correlation)
- PCTBACHMOR (Strong positive correlation with housing values)
- LNNBELPOV100 (Negative correlation with housing values)
The model explained 63% of the variation in housing values, indicating strong explanatory power.
Model Selection and Validation
- Applied bidirectional stepwise regression to ensure optimal model selection. All four predictors were retained.
- Conducted 5-fold cross-validation to assess model performance.
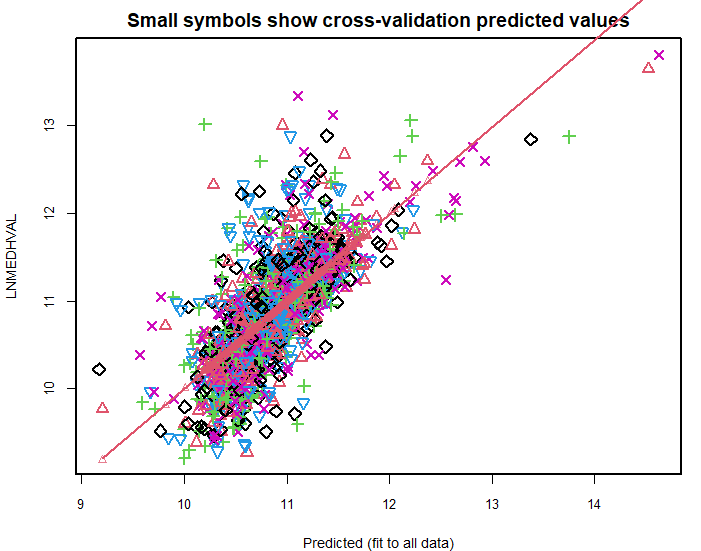
Cross-validation results showing predicted vs. actual values
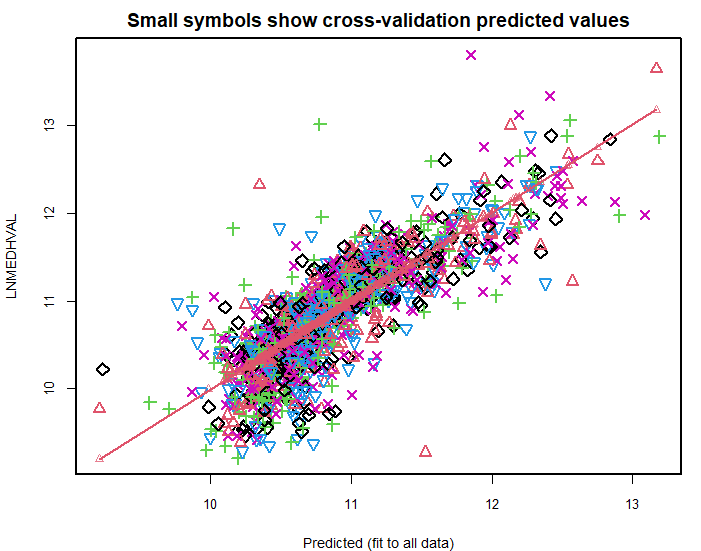
Alternative cross-validation view with different fold symbols
While both models had similar RMSE values, the full model offered higher explanatory power (R²).
Residual Analysis
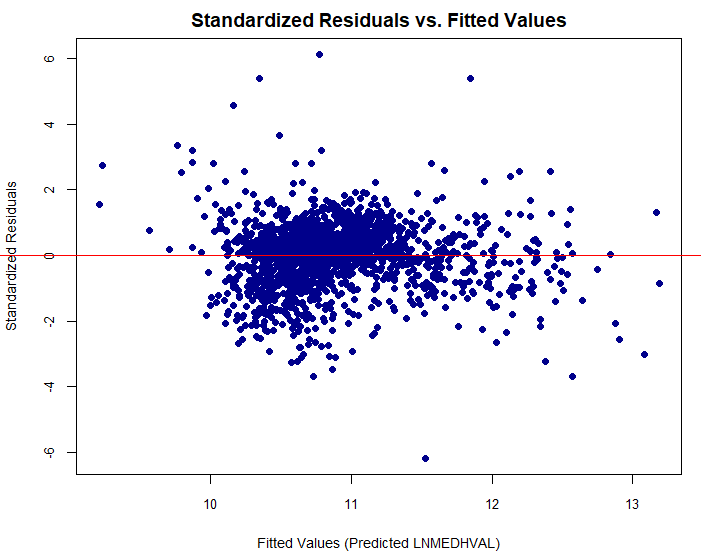
Standardized residuals vs. fitted values showing model fit
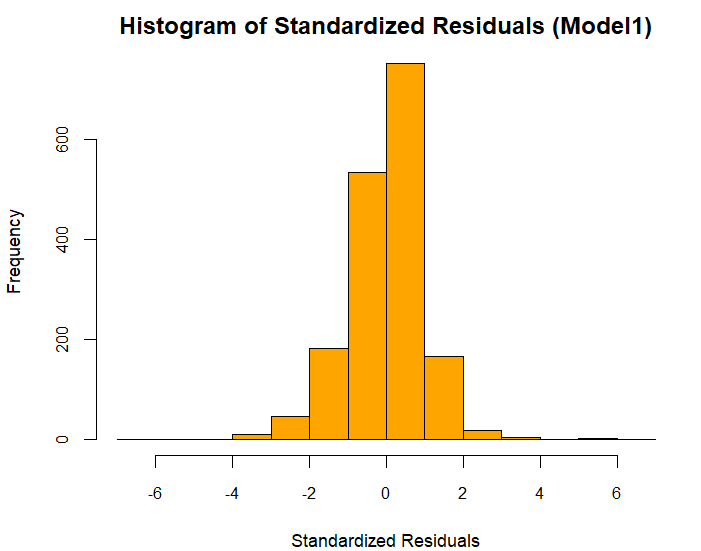
Histogram of standardized residuals showing approximately normal distribution
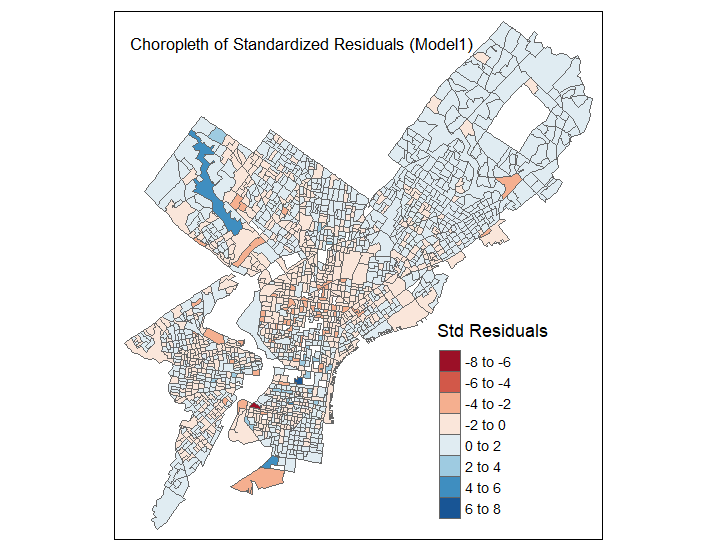
Spatial distribution of model residuals showing areas of under and over prediction
Key Findings
- Education Levels: Higher education attainment strongly correlates with higher housing values, with clustering patterns in northwest and central neighborhoods.
- Vacancy Rates: Higher vacancy rates align with lower housing values, especially in northern Philadelphia.
- Poverty: Higher poverty rates coincide with lower median house values, primarily in the north-central region.
- Single-Family Housing: While this variable had a positive impact, its effect was less significant than education, vacancy, or poverty rates.
Spatial Insights
- Choropleth maps revealed geographic clusters of higher-value housing in Center City and wealthier suburban regions.
- Areas with elevated poverty and vacancy rates exhibited clear spatial clustering, suggesting targeted policy interventions could be beneficial in those zones.
Challenges and Limitations
- Spatial Autocorrelation: Potential spatial autocorrelation in residuals, suggesting some unexplained spatial patterns.
- Non-linear Relationships: Non-linear relationships were detected in some predictors, particularly educational attainment.
- Measurement Issues: Poverty was measured in absolute counts rather than proportions, which may have introduced bias. Converting this to a rate could improve model precision.
Urban Planning Implications
The findings suggest that strategies to improve educational access and reduce housing vacancy rates may enhance property values in Philadelphia's lower-income neighborhoods. These insights could guide targeted urban revitalization efforts and resource allocation.
- Investing in educational resources and facilities in areas with lower educational attainment could help increase property values.
- Targeted programs to reduce vacant properties in northern neighborhoods could stabilize housing markets.
- Anti-poverty initiatives focused on specific geographic clusters could have positive spillover effects on housing values.
Conclusion
This project demonstrates the value of combining regression analysis with spatial data visualization to explore complex urban dynamics. The results provide actionable insights for urban planners, policymakers, and developers looking to address housing inequalities and improve neighborhood stability. By identifying key factors that influence housing values at the block group level, this research contributes to a more nuanced understanding of Philadelphia's housing market and can inform evidence-based policy interventions.
Project Details
Location
Tools Used
- R (Version 4.4.2)
- sf and tmap for spatial data
- DAAG for k-fold cross-validation
- MASS for stepwise regression
Model Performance
Key Variables
- Education LevelStrong +
- Single-Family HomesWeak +
- Vacancy RateModerate -
- Poverty LevelStrong -
Research Highlights
Data Points
Analyzed 1,720 Census block groups across Philadelphia
Spatial Patterns
Clear geographic clustering of housing values, with higher values in Center City and northwest neighborhoods
Key Innovation
Integration of spatial visualization with regression analysis to identify neighborhood-level patterns