Developing a Composite Risk Index
Philadelphia, Pennsylvania | Neighborhood Vulnerability Analysis

Overview
This project created a composite risk index for Philadelphia neighborhoods by combining three key indicators: positive COVID-19 cases, crime reporting cases, and vacant building cases. The goal was to identify areas of high vulnerability and provide insights for targeted urban policy and resource allocation. The analysis was conducted at the ZIP code level using geospatial data and visualization tools in R.
Objective
To develop a composite index measuring neighborhood vulnerability using public health, safety, and economic distress indicators. The index aims to reveal geographic patterns of vulnerability and inform targeted community interventions.
Methodology
Data Selection and Cleaning
Collected geospatial data on three key risk indicators:
- COVID-19 cases (public health risk)
- Crime reports (social and safety issues)
- Vacant buildings (economic distress)
Data was sourced from city-level open data platforms and spatially joined to ZIP code boundaries.
Cleaning procedures included:
- Removing missing values in coordinate fields
- Filtering to positive COVID cases only
- Ensuring consistent projection using Pennsylvania State Plane (EPSG: 2272)
Exploratory Data Analysis and Mapping
Created choropleth maps to visualize each indicator's geographic distribution:
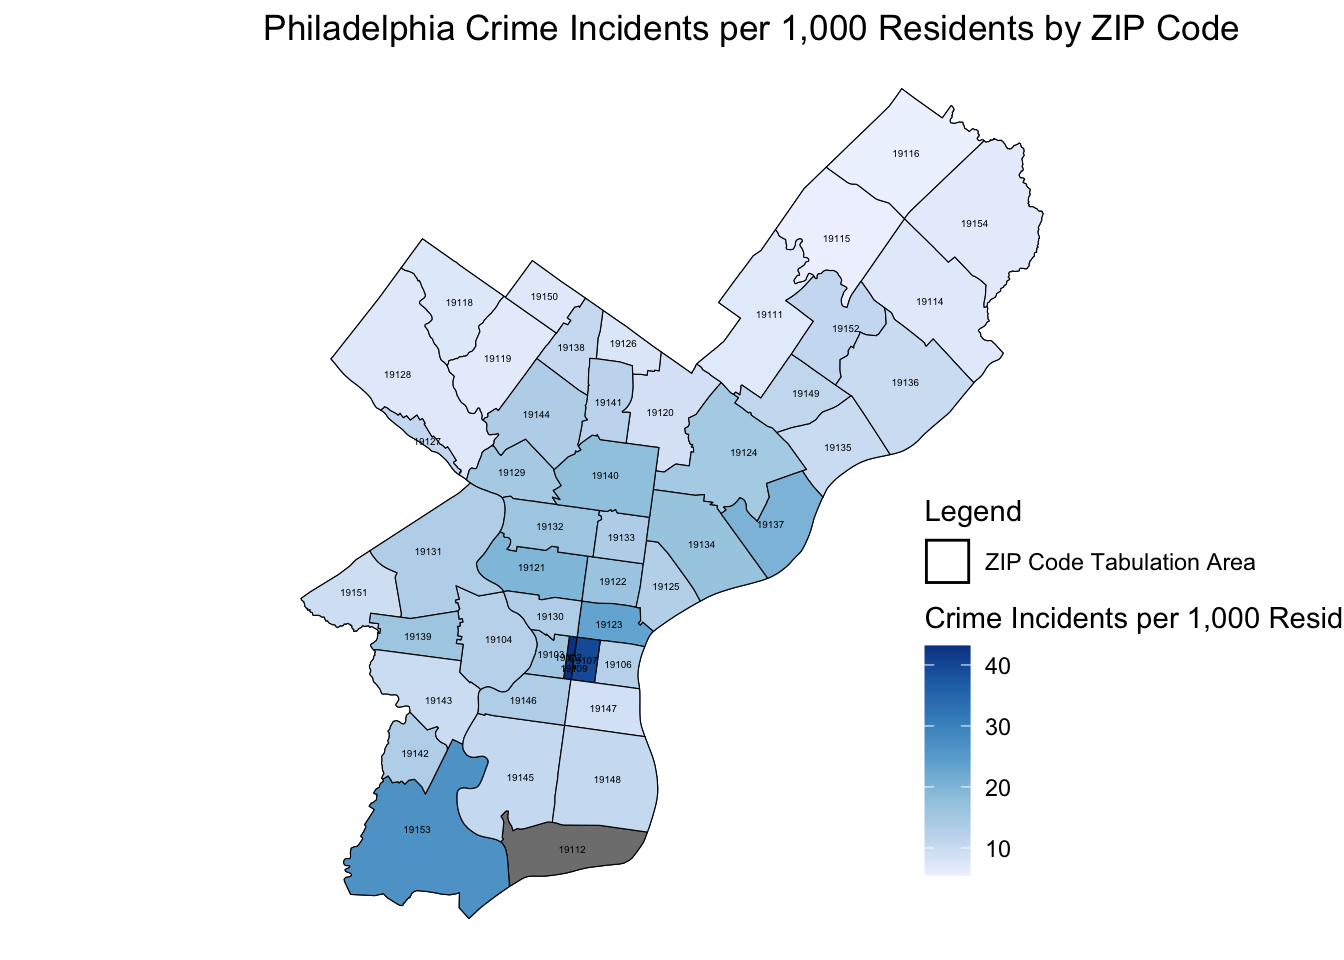
Crime rates – High in Center City and western Philadelphia
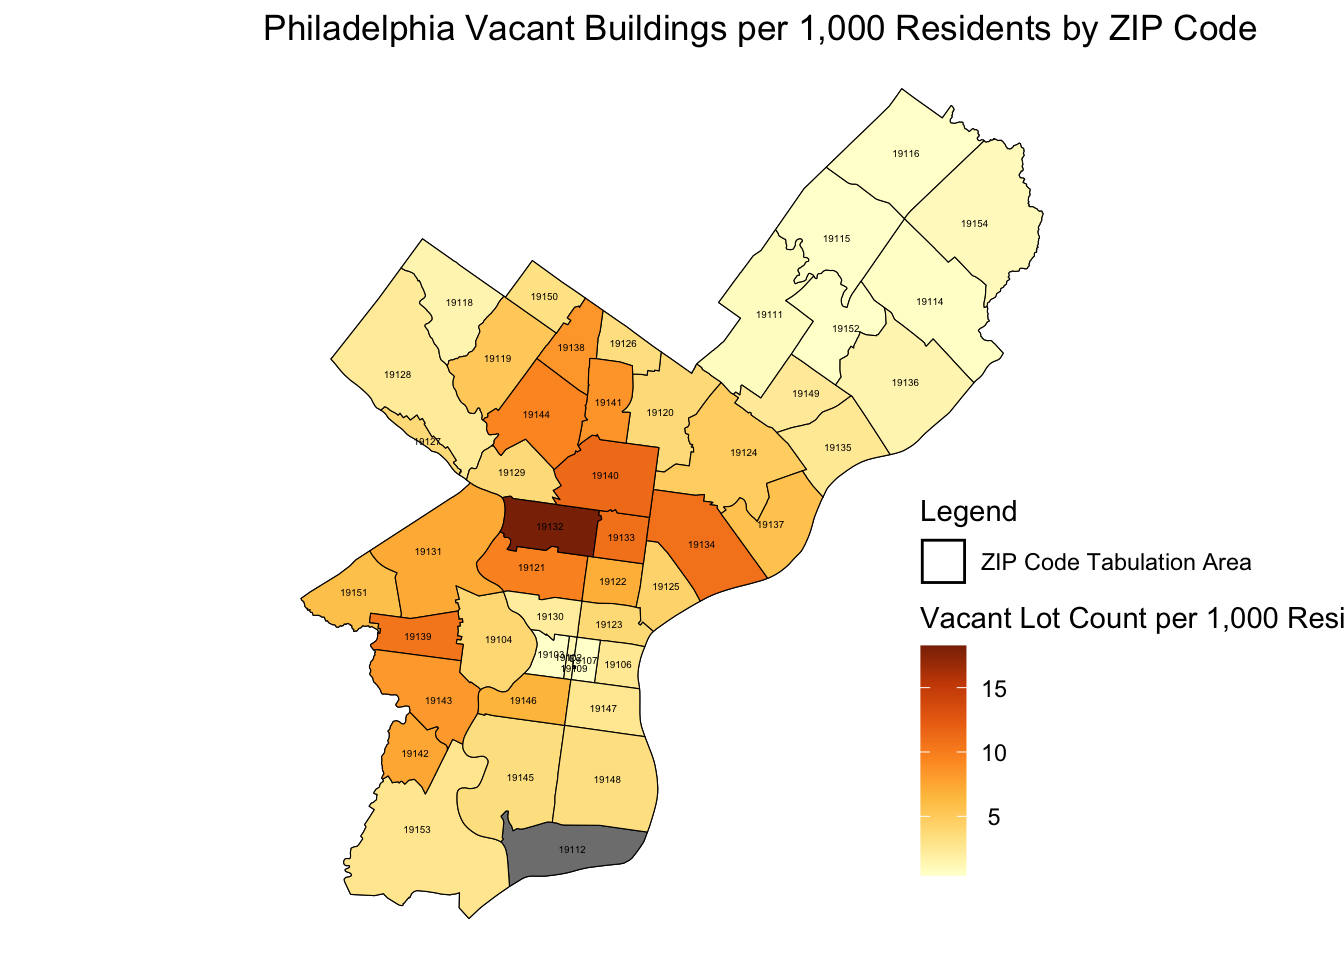
Vacancy rates – Concentrated in north-central and western areas
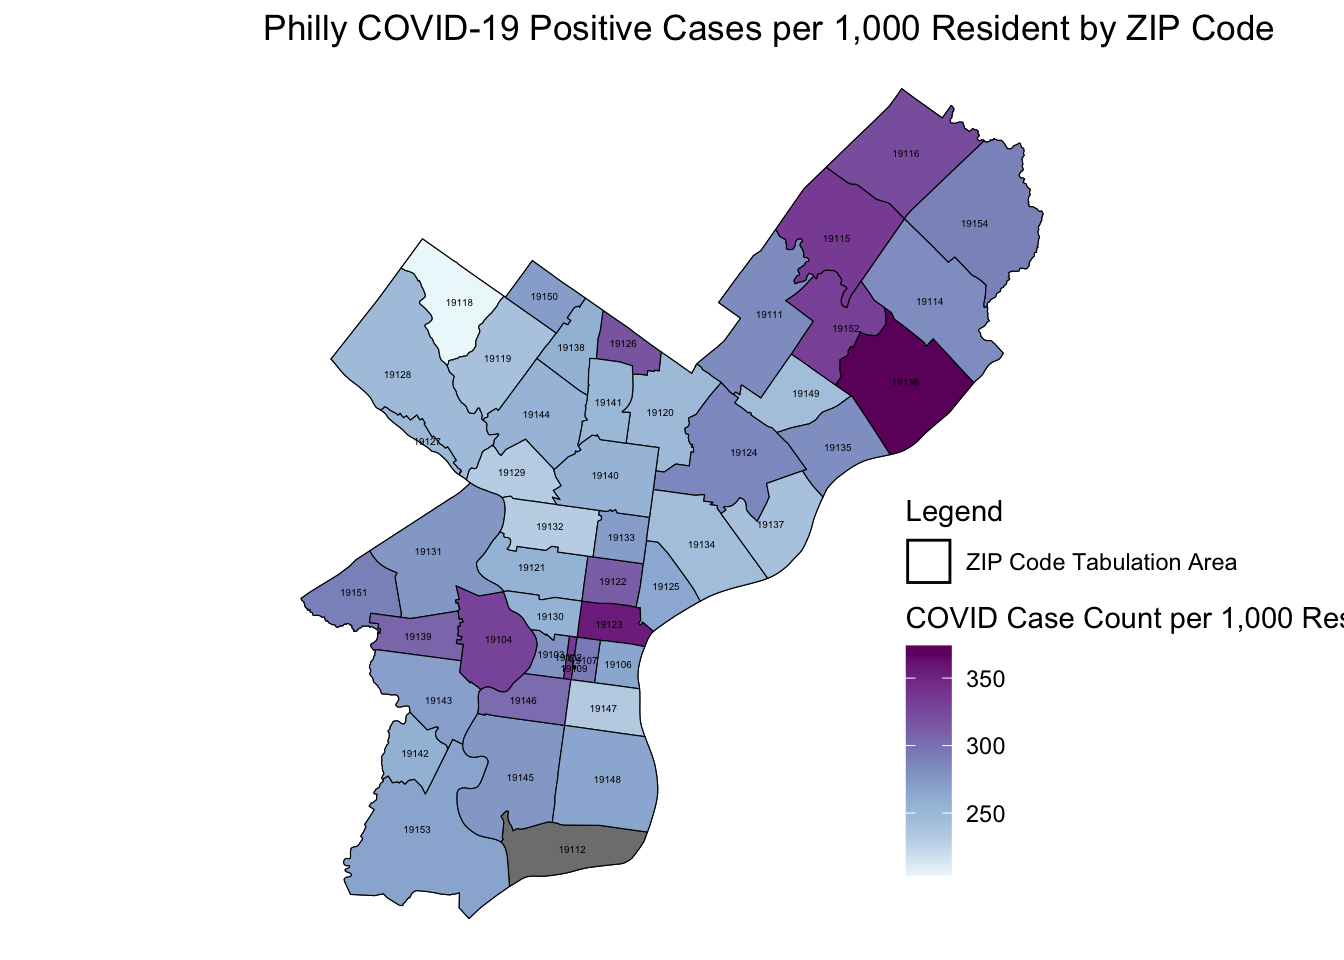
COVID-19 cases – No clear geographic pattern across Philadelphia
All maps were created using the sf and ggplot2 packages in R, with consistent color scales to facilitate comparison across indicators.
Composite Risk Index
To create a meaningful composite index, each indicator was normalized on a 0–1 scale:
- Crime per 1,000 residents
- Vacant lots per 1,000 residents
- COVID cases per 1,000 residents
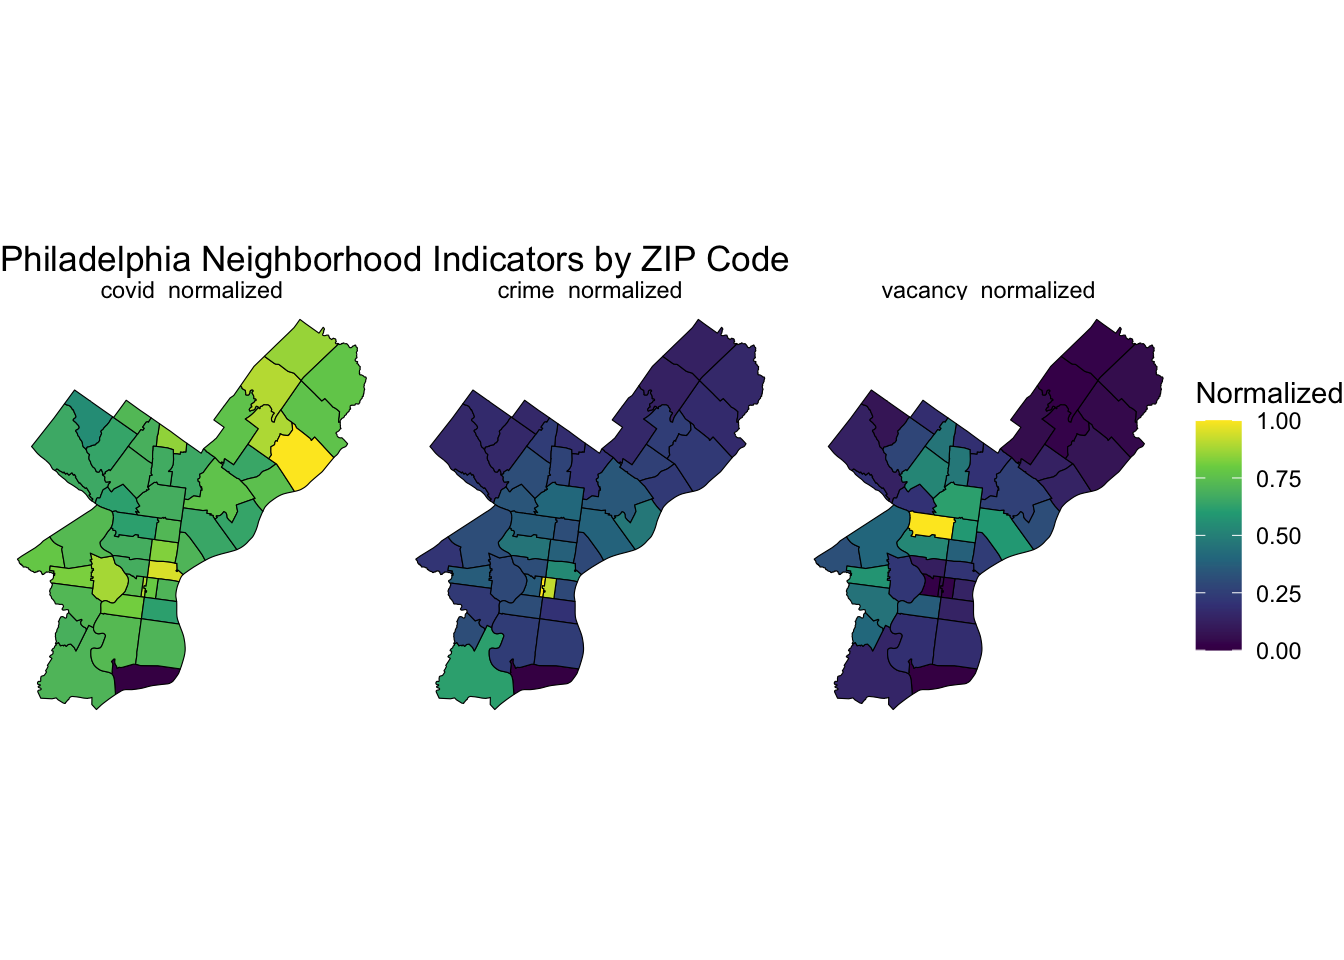
Normalized indicators showing the relative intensity of each risk factor
The composite score was created by averaging the three normalized indicators, giving equal weight to each factor. Neighborhoods were then classified into three risk categories:
Final Risk Map
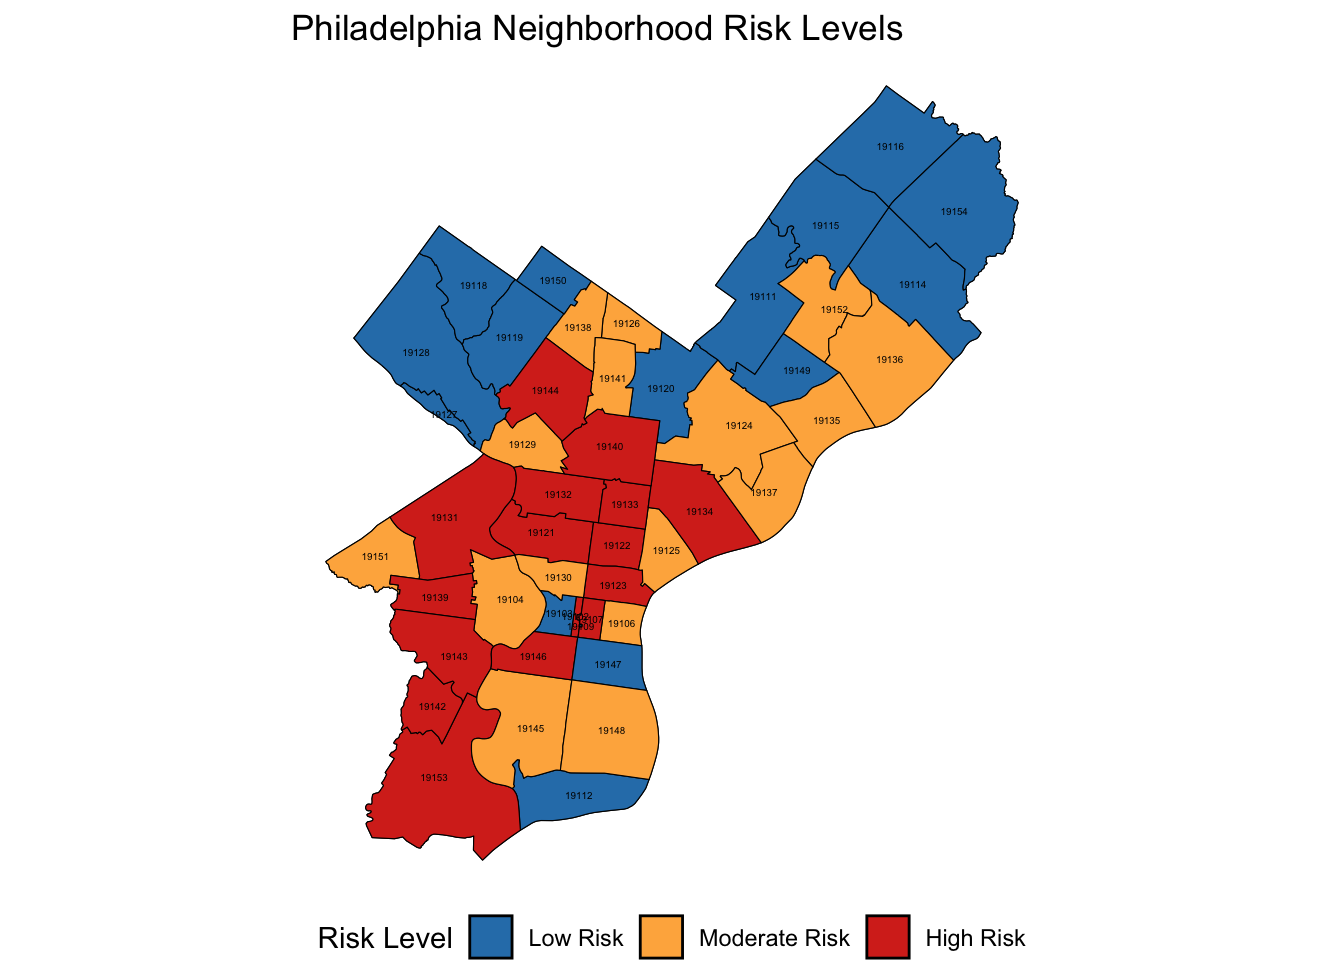
Composite risk map showing clear clustering of high-risk neighborhoods in west and central Philadelphia
- Low Risk (bottom third of composite scores)
- Moderate Risk (middle third of composite scores)
- High Risk (top third of composite scores)
The final risk map was created using ggplot2 and sf packages, with a categorical color scheme to clearly differentiate between risk levels. The map reveals distinct spatial patterns of vulnerability across Philadelphia neighborhoods.
Key Findings
- Crime and Vacancy Rates: High crime and vacancy rates are clustered in Center City and north-central Philadelphia, areas known for historic disinvestment and economic challenges.
- COVID-19 Cases: COVID cases showed less spatial clustering, suggesting health disparities may not directly align with economic and safety issues.
- Composite Risk Pattern: High-risk neighborhoods align with historically underserved areas, reinforcing the link between safety, economic stability, and health outcomes.
Spatial Insights
- Higher vacancy and crime rates were concentrated in ZIP codes with historic disinvestment.
- Lower risk zones were found in northwest and southern Philadelphia, where economic stability is stronger.
- The composite index helped identify areas where multi-faceted interventions (crime reduction, economic investment, healthcare access) are needed.
Challenges and Limitations
- Spatial Resolution: ZIP code boundaries may not align with true neighborhood boundaries, introducing aggregation bias.
- Population Density Effects: Higher crime rates per capita could reflect high population density rather than increased vulnerability.
- Indicator Correlation: Crime and vacancy rates may be correlated, potentially skewing the composite index.
- Omitted Variables: Economic indicators like income and employment rates were not included due to data availability.
Urban Planning Implications
The composite index provides a valuable tool for policymakers and urban planners to:
- Prioritize resource allocation in high-risk neighborhoods.
- Develop integrated solutions that address economic distress, public health, and neighborhood safety.
- Inform community-driven revitalization efforts by targeting vulnerable areas.
Conclusion
This project demonstrates the value of combining spatial analysis and multi-variable risk modeling to assess neighborhood vulnerability. The composite index offers a powerful tool for identifying geographic patterns of risk and guiding data-driven urban policy decisions. By integrating public health, safety, and economic indicators, the analysis provides a more comprehensive understanding of neighborhood vulnerability than any single metric could offer.
Project Details
Location
Tools Used
- R (Version 4.4.2)
- sf for spatial data handling
- ggplot2 for data visualization
- tidyverse for data manipulation
- zipcodeR for geographic matching
Risk Indicators
Risk Categories
- Low RiskNorthwest & South
- Moderate RiskNortheast & East
- High RiskWest & Central
Research Highlights
Data Integration
Successfully combined health, safety, and economic indicators into a single risk metric
Spatial Analysis
Identified clear geographic patterns of vulnerability across Philadelphia neighborhoods
Policy Applications
Created a practical tool for guiding resource allocation and targeted interventions